
Sea Level Will Rise in “Steps” Not Smoothly
Range of Projections for Sea Level with smooth curves can be very misleading (2017 NOAA Technical Pub 83)
Confusion abounds about the rate of sea level rise, particularly the projections for what to expect in the future. Generally the perception is that the rate of rise may accelerate, but still somewhat smoothly. In fact there will almost certainly be relatively abrupt “steps” to the pattern, due to pulses of meltwater.
If we are to adapt to dramatically higher sea level over the course of this century we need to dispel the misunderstandings and change the way we look at sea level forecasts. The reasons for the misunderstandings can be explained quite simply. For example look at the the simple graphic above from the latest US Government Report on the subject (NOAA Technical Report 83 – January 2017). Up front, I want to say that it was an excellent piece of work. It’s a good example, as it is current and particularly clear, compared to other more technical presentations. I have the highest regard for lead author Dr. William Sweet and his team, who I would be proud to consider colleagues. Nonetheless I want to explain why it is misleading to the non-expert, and even to some experts.
On the chart, It is easy to see the colorful six simple lines from dark blue to red, depicting sea level increasing anywhere from about one to eight feet, (roughly 30 cm to 2.5 m). Many of us think the lower line should not even be shown, since it is merely a flat-line extension of the rate from the last century, before the oceans were warmed, the glaciers went into aggressive retreat, and sea level started rising noticeably. There is no believable case for that line to hold true this century — unless Congress repeals the Laws of Thermodynamics (that last part is a joke BTW) In fact that line can be seen as a reference point for comparison for what we now face, which is fine.
The other five lines are smooth curves showing various rates of exponential growth. This creates an impression that sea level will follow one of those lines. But note that they are almost evenly spaced. In fact the metric units shown on the left are spot on: half meter, one, one and a half, two, and two and a half. That is clearly putting some “markers” in the absence of precise numbers. There are a few fundamental reasons that we cannot predict when we will get large amounts of sea level rise:
First, sea level does not happen smoothly, following a smooth curve. Recall that changes in sea level primarily reflect the amount of ice on land, 98% of which is in two places, Antarctica and Greenland. For scale, those two ice sheets combined are roughly the area of North America. The ice averages more than a mile high (1.5 km). As you can imagine, a chunk of ice the size of a continent will not melt smoothly like an ice cube you put on the table. Because of its size, the movement of glaciers, the melt water and more, there will be sudden points of collapse — massive collapse like the biggest landslide or earthquake you can imagine. Similar to an avalanche or mudslide, we may know that conditions are right, but there is no way to predict location, magnitude, and actual timing far in advance.
Back to Antarctica and Greenland, we now can observe many catastrophic collapses of modest scale, but there is no way to scale and predict precisely what will happen over the next eight decades, as these graphs suggest. We know from geologic history that sea level has not risen smoothly, but rather with regular “steps” or bumps as seen in this cleaned-up graphic of our best reconstruction of sea level rise over the last twenty thousand years — since the peak of the last “ice age.” See the graph just below to illustrate this.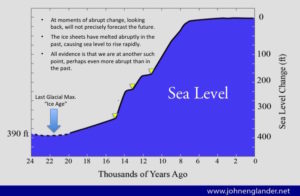
For example, note that the first of the three steps or bumps in the line, depicts about 65 feet of rise in four centuries. That averages more than a foot and a half a decade (50 cm) – a rate that is almost unimaginable. We would be hard pressed to adapt to even that speed of sea level rise.
Secondly, we are now warming MUCH faster than thousands of years ago. The melting rate of Greenland and Antarctica will surely not follow the historic rate. The recent acceleration of warming and melting is dozens, if not hundreds, of times faster than what we know about in the historical record. For that reason, predicting the future based on the past is misleading. (See “Sea Level Rise in the Rearview Mirror“)
Also even the measurements about recent decades of sea level increase are misleading, because the amounts have been so small. While it is important to measure the change and to look for trends that should alert us to rapidly accelerating sea level rise, the tiny amounts can be very misleading. Presently we are measuring sea level at the rate of tenths of a millimeter or hundredths of an inch a year.
For example, an article in Scientific American recently explained that the rate for the last few decades was higher than previously thought, 3.9 mm, rather than the 3.2 mm that had been accepted. (For non-metric Americans that’s roughly an increase from one eighth of an inch to a sixth of an inch.) While the scientists should try to refine the numbers, this can be a distraction.
Finally the range of multiple scenarios depicted invites many, even engineers, to take an average sea level rise, in the absence of knowing which one “is real.” That too is foolish and dangerous. We don’t plan for average hurricanes or earthquakes, or national security risks. We plan for rather extreme scenarios. With sea level rise it is even smarter to plan for worst. Unlike events that may happen, and will hit a location, sea level rise is now “locked in” to some degree. It will hit all coastal areas and will not recede for centuries.
We need to get real about rising sea level. My current estimation is that we are going to have five or ten feet of sea level rise this century, and more the next. The debate about hundredths of an inch is a distraction. The curves may help to imagine what could happen, but should not mislead us to think that actual sea level will follow any smooth curve. Over the long term, it never has, and never will, as long as there are vast volumes of ice to melt on a rapidly warming planet. We need to get prepared for those steps or bumps as soon as possible. We do not have the luxury to wait for the collapse of the large Antarctic glaciers to begin our adaptation.
It will take us at least a building cycle to adapt to higher coastal elevations. That is why we need to begin the planning and adaptation ASAP. (This is the focus of our new nonprofit, The International Sea Level Institute, to help various professions understand, plan, and adapt to higher sea level. www.sealevelinstitute.org )