
Featured in NY TIMES Major Climate Article
The New York Times just published a comprehensive article on climate change in Friday’s online version, in which I am prominently featured. The author of this excellent article on climate change and Greenland’s melting glaciers is the pre-eminent NY Times columnist Bret Stephens. The genesis of the article was his joining me in August on one of my fact-finding expeditions to Greenland.
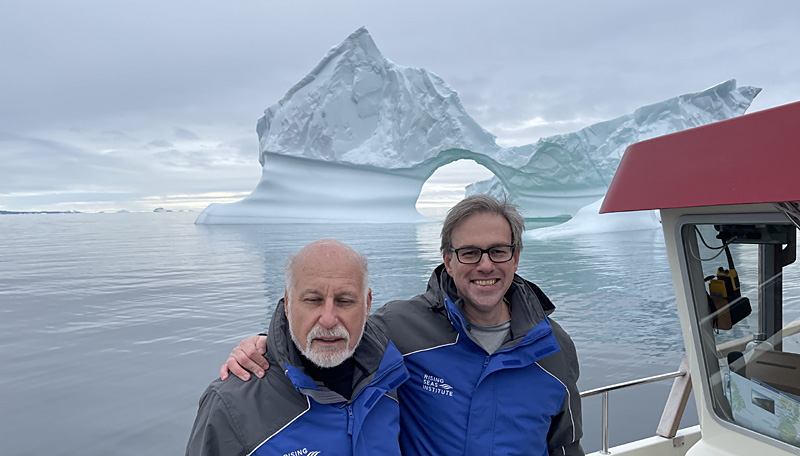
John Englander and Bret Stephens off the West coast of Greenland, August 2022
Bret and I have an interesting background, as he highlights in the article. Several years ago, I was one of 40,000 climate scientists and activists who signed a letter asking for him to be fired from the NYT on the basis that he was some variety of “climate change skeptic.” The request was politely rejected by the Editor.
Later, I followed up with an invitation directly to Bret to meet and talk, to which he agreed. At the end of an hour-long meeting in his office, I invited him to join me in Greenland for one of the Fact-Finding Expeditions I organize through the Rising Seas Institute. He found that interesting and got it approved by the Times.
After a two-year delay due to the pandemic, he joined me there this past August, becoming the basis for this major article on the broader issue of climate change. I am quoted extensively – and accurately – in Bret’s article. The link to the online article and graphics is HERE:
If you prefer the print version, tomorrow’s NY TIMES SUNDAY EDITION (October 30) will feature the same article and images.
Mr. Stephens and I agree on a number of issues, and disagree on some. Pro or con, I urge you to read his piece. It will challenge you to think about climate in different and perhaps unfamiliar ways.
You may agree or disagree with his conclusions, but this is one of the most thorough and balanced articles about the climate problem and solutions in recent years.
Please let me know if you agree or disagree with Bret Stephens. Your comments will be invaluable to me as I map out new ways to communicate the facts (not the hype or politics) of climate change and Sea Level Rise.
John